Concept prototype · Fictional terrain

An asset in its landscape.

Omnvex Atlas is a design study for Australian property teams. Explore three fictional properties through bushfire, flood and storm overlays, then work out what to ask the surveyor.

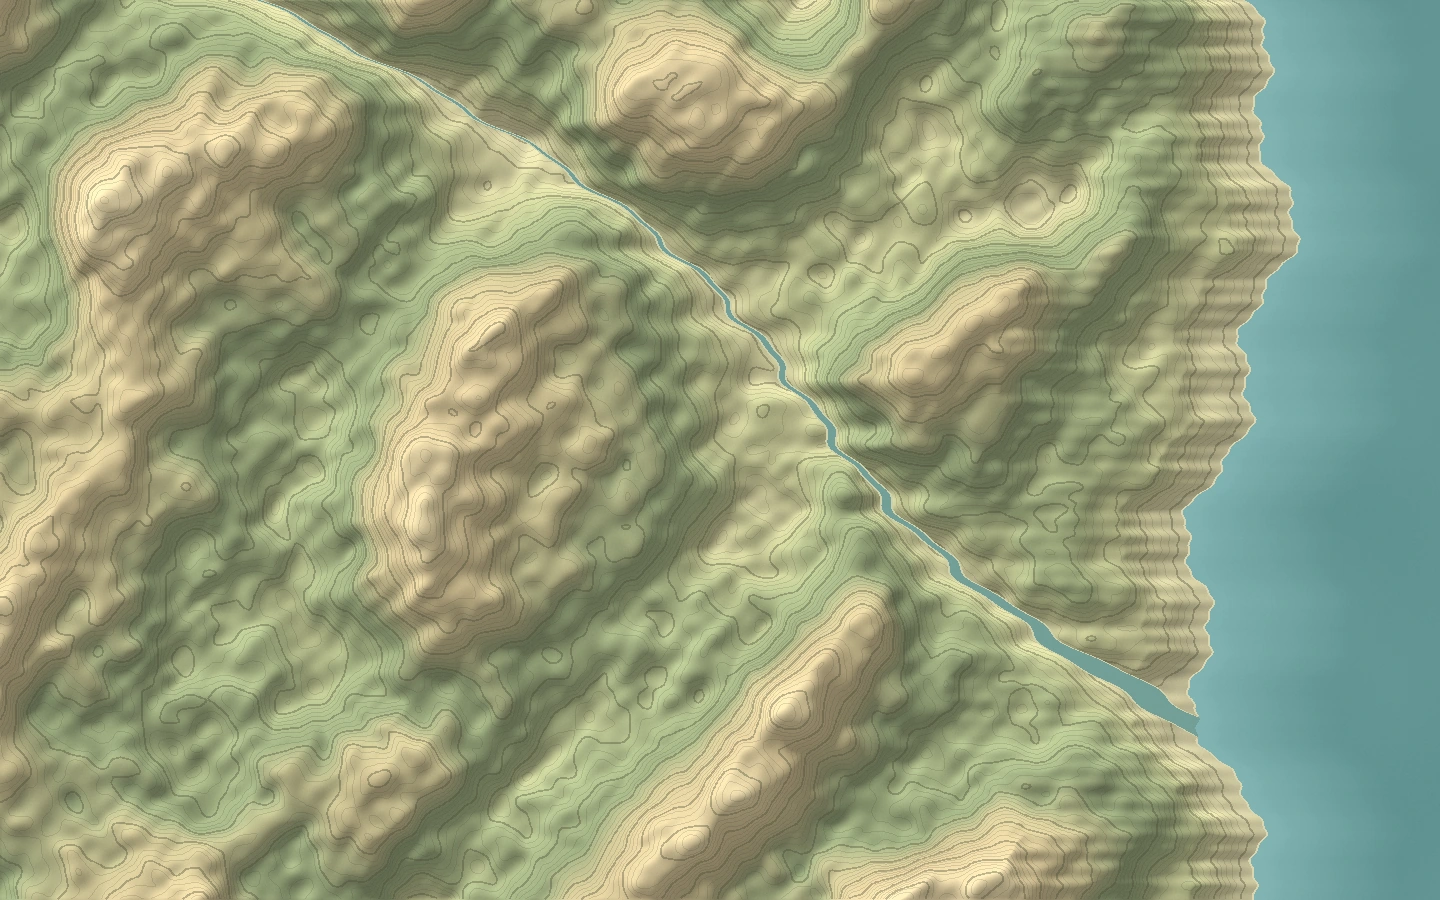
Synthetic relief of the fictional coastal transect
Estuary Works · relief atlasFlood overlay

Field study / Estuary Works

Would water reach the works floor?

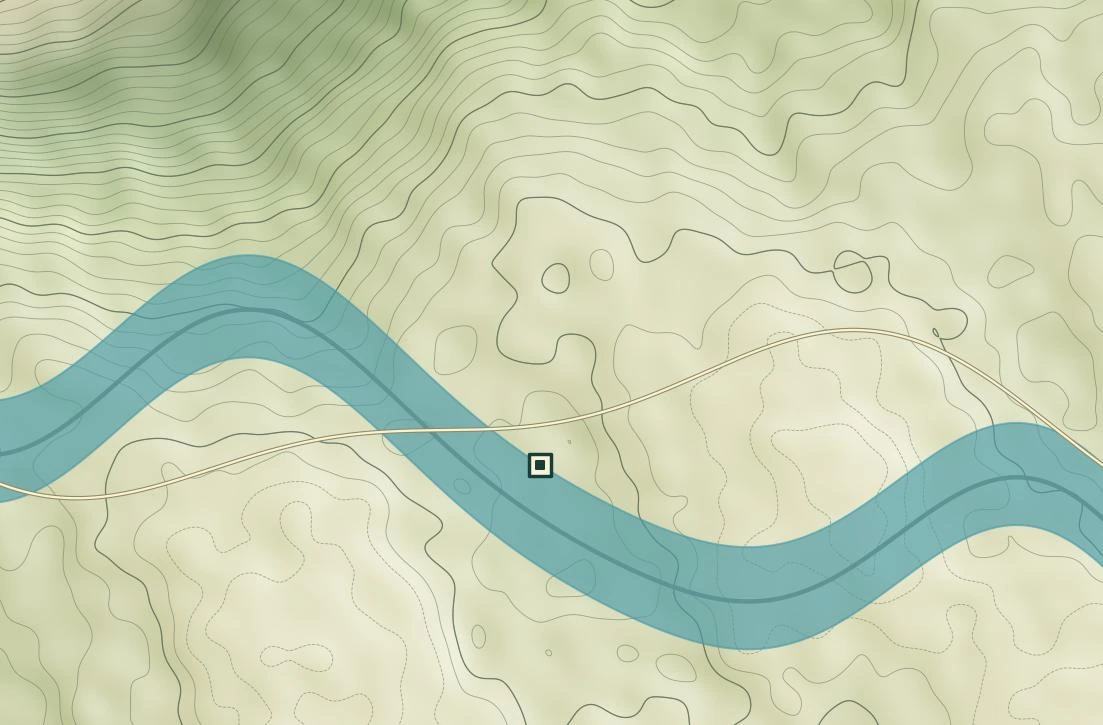
An asset manager wants to know whether the floor of a riverside facility could flood. The blue band follows the drawn river. Its width illustrates an area to check. Water depth, peak level and the height of the floor are all unknown.

Estuary Works
Estuary Works marker beside a drawn watercourse with a broad blue illustrative band following the river.

The blue band follows the drawn river. Its width illustrates an area to check.

Schematic study sheet · Synthetic terrain

Reading the sheet

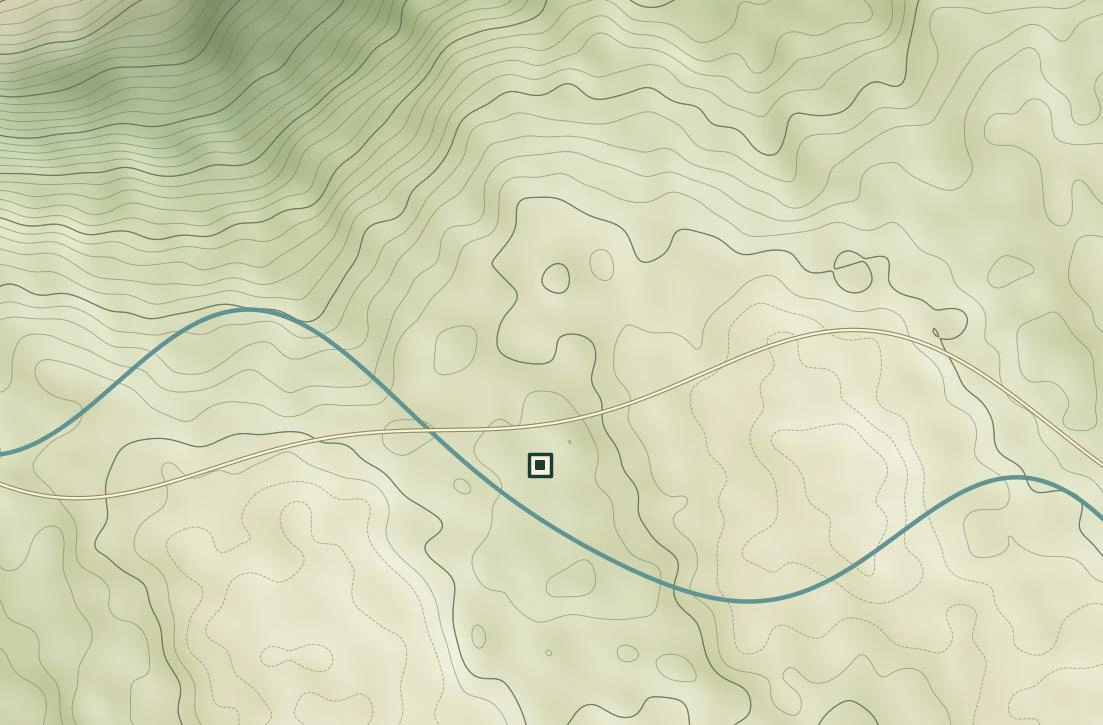
This schematic simplifies the relief atlas. Choose Base terrain and follow the fine blue watercourse to the square site marker. It places the fictional facility beside the river as the plain widens.

Choose Flood layer. A broad blue band appears along the watercourse while the square site marker stays in place. To find the nearest road, switch from this schematic to the relief detail below.

In this relief detail, the Estuary Works marker overlaps the drawn access road. The dot stands for the whole facility. It gives no position for the loading door, the lowest floor or the point where the driveway meets the road.

Inspect Estuary Works in the atlas Compare the base and flood views in the brief · p. 4

From the product brief / p. 7

The property review note.

The analyst gives the asset manager a short handover. The first line describes what a colleague could point to on the same sheet. The second names the documents that would let the colleague test it. In the third, the analyst leaves the decision open.

Read the original note
Omnvex / AtlasIllustrative property note

What remains unknown at Estuary Works?

Visible in this illustration
The watercourse curves past the marker on the schematic study sheet.
Evidence to request
A surveyed parcel boundary, site elevation and a documented flood layer with a date and source.
Decision pending
Keep the review open until the input quality and site-specific context can be checked.

Proposed verification

What would settle the question?

A reviewer working on a real property would need these records before comparing a water level with a floor level. The fictional sheet supplies none of the measurements.

Suppose a facilities manager sends a floor height and a council study gives a peak water level. Ask what each number is measured from. A height above the yard and an elevation relative to a survey datum cannot be compared directly. Until both use a common reference, even two precise-looking figures leave the floor question open.

Surveyed parcel and floor levels
Ask the surveyor to identify the footprint and lowest finished floor. Record the survey date and vertical datum so the floor and flood levels can be compared.
A local flood study
Obtain the study that covers the parcel. Check the issuing authority, publication date, event scenario and elevation datum before reading the modelled water level at the site.
Drainage and site records
Ask the facilities team for current drainage plans and dated observations of earlier events. Check whether culverts, outlets or recent ground works change how water can reach the building.

The field index

Three places to start.

Each entry opens a different pairing of property and hazard. Keep one layer selected in the atlas and change the site to compare two properties under the same conditions. Use Hide overlay to read the road and terrain on their own.

Cartographer’s notes

Where the lines come from.

Atlas is an internal product proposal under the Omnvex brand. Its intended readers include councils, insurers and asset managers. The three invented sites share one drawn coastline.

A shore drawn for the sheet
The relief is a local image. Browser JavaScript places the road, site dots and hatched layers over it as SVG shapes. Their positions are specified on a 1,000 by 625 drawing grid. The grid has no ground scale or geographic coordinates, so the distance from a dot to a boundary cannot be read in metres.
A band with a known origin
The script joins points along the drawn river and offsets each bank by a width chosen for that stretch. This makes the flood band broaden downstream. The bushfire and storm outlines are also drawn in advance. The browser displays the selected outline and its written observation. Generating these views involves no live GIS service, cloud computation, NVIDIA SDK or CUDA calls.
Taking the question off the page
The product brief proposes dated imagery, surveyed boundaries and weather observations as future inputs. The working prototype loads local illustrations only. Each view pairs an observation with an evidence request. There is no generated report, probability of loss or forecast to attach to a property file.

Take one question back to the sheet.

Choose a site, keep its layer on, and write down the one record you would request first. The atlas supplies an illustration without a measured distance or elevation. Before you start, read how the analyst framed that request in the original note.

Omnvex

Team and contact.

Jiaxuan Li

Founder, Omnvex

Omnvex is based in Sydney, NSW, Australia. No verified public business contact is listed. The field atlas and product brief are available for readers reviewing the proposal.